Fintech Infrastructure 101 - Overview & Market Landscape

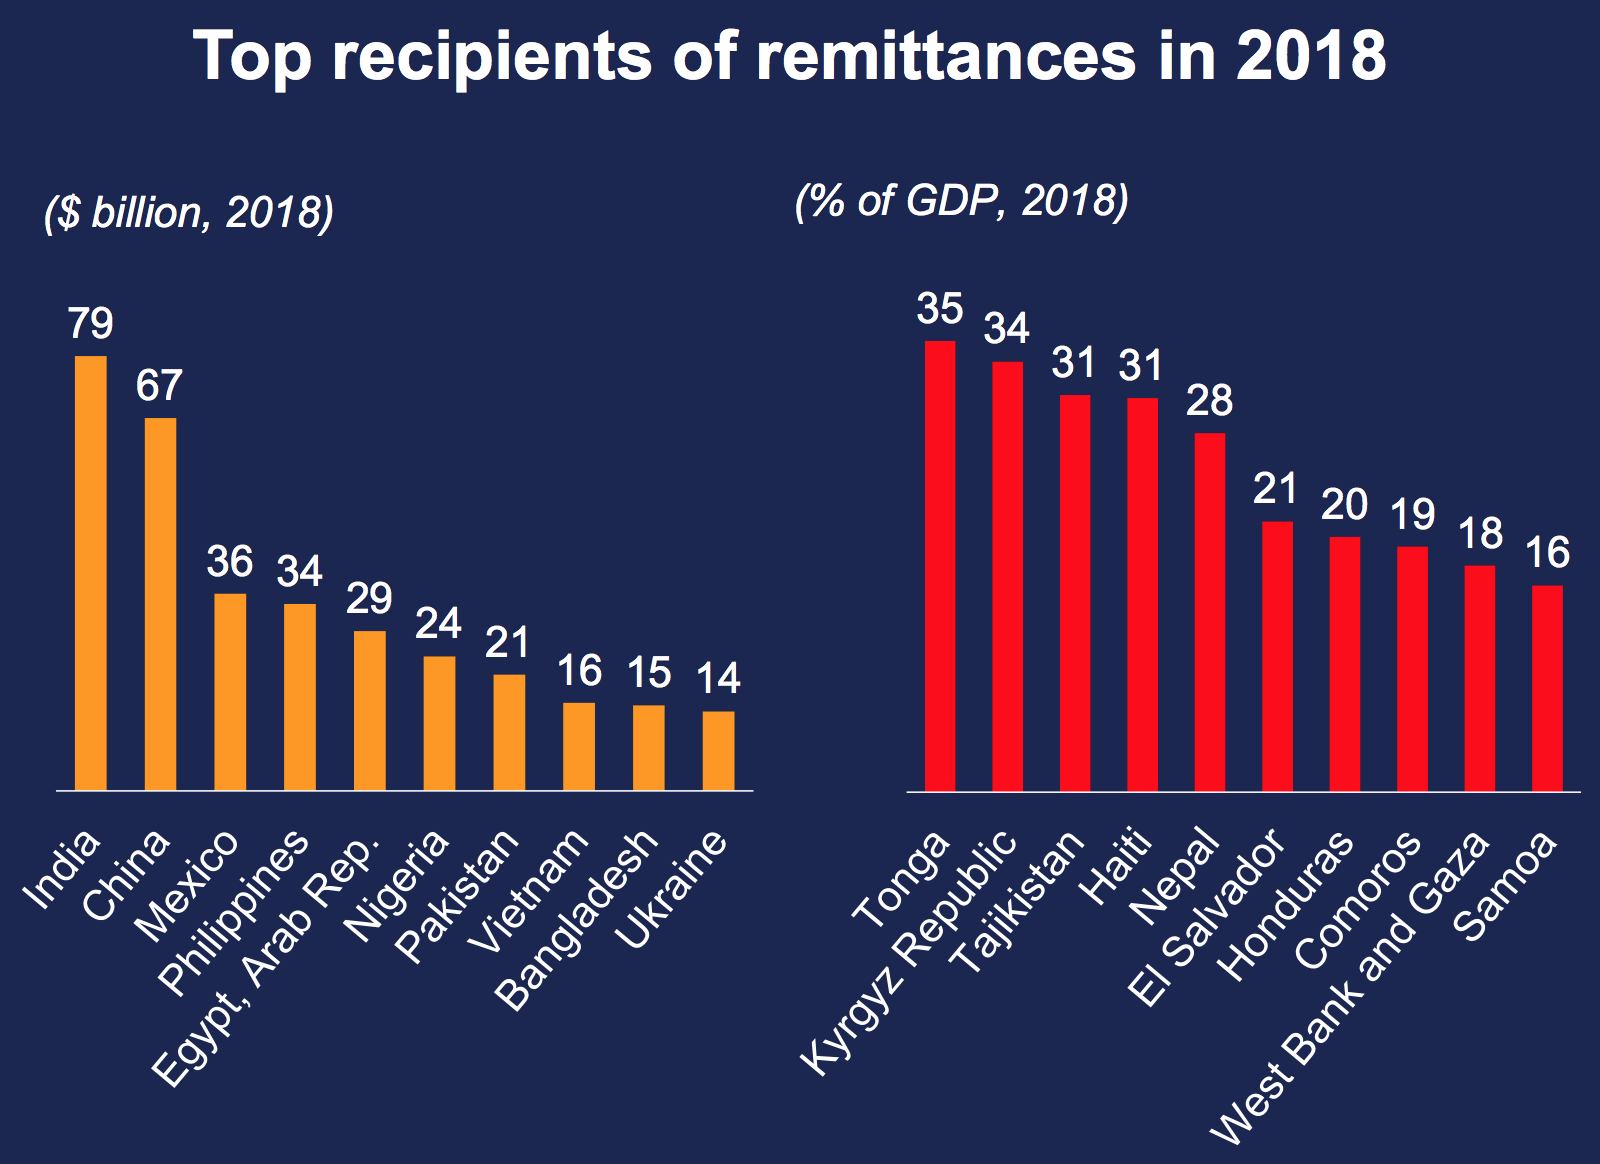
Financial Technology (“Fintech”) startups are companies targeting all of the core financial applications including Banking ($7T), Wealth Management ($75T), Capital Markets ($74T), Lending ($8T), Real Estate ($8T), Insurance ($5T), Payments ($2T), and Remittances ($800B). 

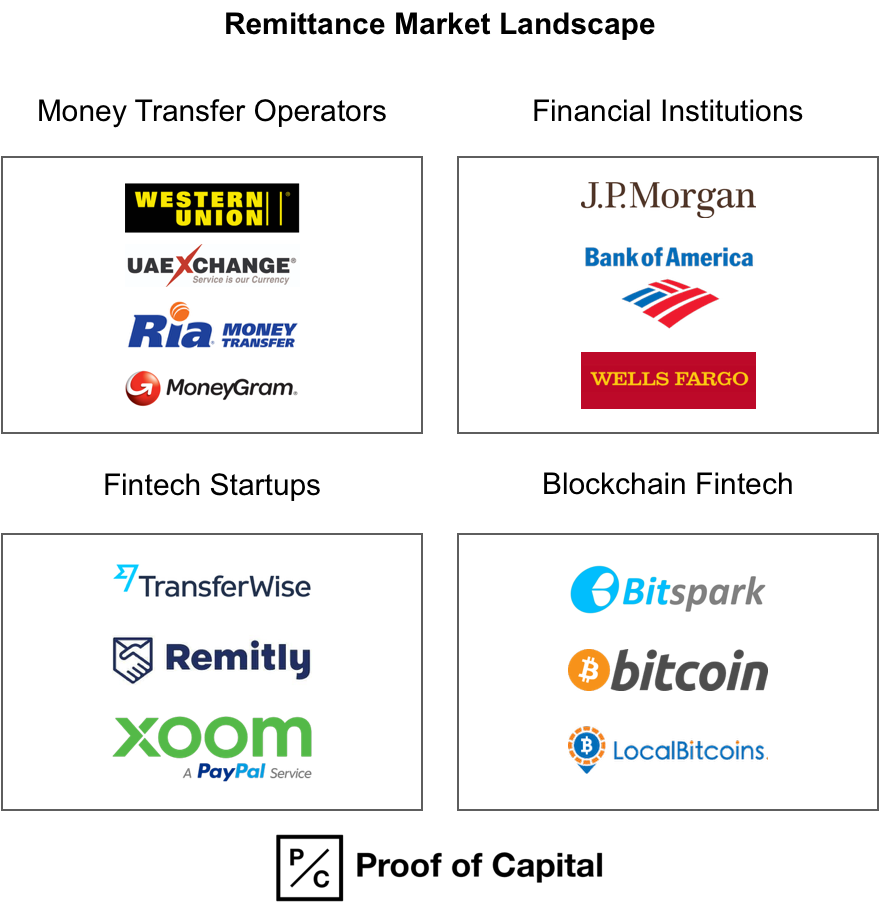
While diverse in scope, all of these activities are interconnected and largely facilitated through traditional financial institutions including: JP Morgan, Wells Fargo, HSBC, BNP Paribas, MUFG, Bank of America, Bank of China, Industrial & Commercial Bank of China, Citigroup, and many others.

However, many of these new startup fintech startups are being built by developers, who are a very new customer segment for traditional banks and who are changing the needs of the underlying financial infrastructure itself. Before diving into how the infrastructure ecosystem is changing, I will cover the major trends that are the root cause of this change.

Major structural trends in the fintech landscape

  1. Increasing global customer bases

  2. Embedded Fintech

  3. Unbundling of Financial Institutions

  4. Developers as the end customers


Increasing global customer bases

Financial services companies historically have dealt with a limited set of customers across known geographical barriers. Traditional banks started with local, city, regional, state wide, and country-wide offices and worked with international correspondent banks to transfer money across jurisdictions. 

Banks were not set up to handle international customer bases, and the regulatory and compliance overhead of sending international payments is a huge sunk cost within the current system. On average it costs ~7% to send remittance payments internationally between retail customers.

In contrast, digital commerce platforms are required to handle international customer bases from day one. For example:

  • Apple - 1.4B active apple device users across every major continent worldwide. 

  • Airbnb - 650,000 hosts, 150M renters, 2M bookings per day, across 191 countries. 

  • Shopify - 600,000 merchants across 175 countries with $15B in GMV for 2019.

  • Uber - 3M drivers and 75M riders across 80 countries, with $40B in GMV for 2019.

  • Binance - 15M users across 180 countries, with $1T in trading volume on the platform and $1B in cumulative profit in 1.5 years of operation. 

The financial infrastructure platforms of today must be able to handle customers across all jurisdictions, all exchanges of value, all types of use-cases (producers, distributors, consumers), and all from the start.


Embedded Fintech

The financial sector and fintechs have historically been thought of as a vertical industry serving specific use-cases (banking, lending, trading, etc.). However we are now seeing the rise of “embedded fintech.”

Rather than standalone applications, financial features are being embedded into all of the consumer and business applications that people are using already. Here are several examples:

  • Uber - Launching Uber money to allow drivers to collect earnings in real time & issue credit/debit cards to spend their balance. 

  • Grab - Created their own digital wallet to be able to hold and spend value in their digital wallet (similar to WeChat pay). 

  • Google - Now offering checking accounts through Citigroup and Stanford Federal Credit Union.

  • Facebook - Is trying to launch Libra, one of the more ambitious bets to develop their own digital currency. 

  • WeChat (owned by Tencent) - Has 1B users and does $1B in total daily payment transaction volume via WeChat Pay. 

Embedded Fintech.png

Unbundling of Financial Institutions

Financial companies historically were large monolithic applications that served the entire suite of financial products to all of their customers. For example, Wells Fargo provides all of these services across these segments: 

  • Consumer - Checking accounts, savings accounts, debit cards, credit cards, FX, remittance, and payments. 

  • SMB - Business checking and savings, debit and credit cards, business lines of credit, loans, merchant services, credit card processing, and PoS systems.

  • Enterprise - Commercial checking, financing, real estate, employee benefits, institutional investment, investment banking, securities, and treasury management. 

Original image created by Tom Loverro: https://tomloverro.com/post/102797126721/banking-is-under-attack-heres-a-screenshot-of

Original image created by Tom Loverro: https://tomloverro.com/post/102797126721/banking-is-under-attack-heres-a-screenshot-of

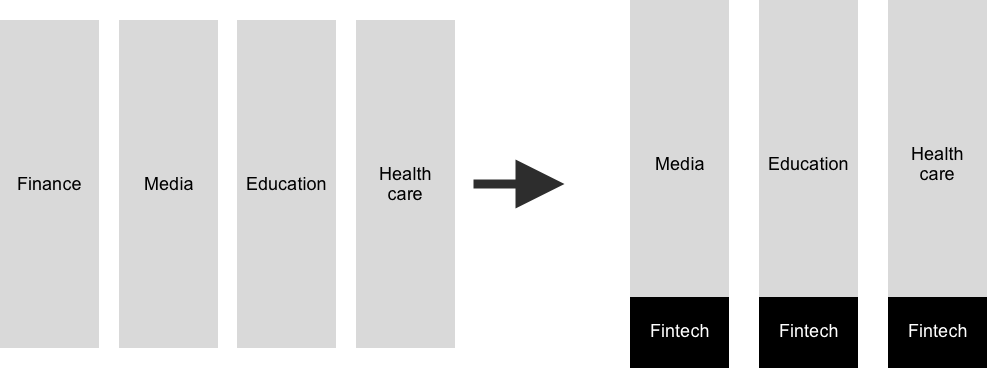
As fintech companies started gaining traction, they largely targeted narrow verticals and customer segments. Here is a good visual representation showing how each fintech company is attacking a very specific product segment that Wells Fargo provides: 

Traditional financial companies are feeling the pressure from large competitors and small fintechs across every single segment and product category they serve.


Developers as the end customers

Financial institutions were built to on-board people as customers (retail) or business owners as customers (SMB); however, today there is a new class of users needing access to the underlying financial infrastructure these banks use - developers.

Developers not only want access to the data (“Open banking”) of financial institutions, but more importantly want access to the underlying functionality that banks provide. 

Prior to fintech platforms, if a developer wanted to start a new fintech company it typically took 2+ years to develop a partnership with a bank before getting up and running. Now we see developers using fintech platforms (ex. SynapseFi, Sila, etc.) to spin up new fintech apps in a matter of hours. This reduction of effort is leading towards a rise in the number of fintech applications in the marketplace. 

Developers as the banks customers.png

My prediction is we will see a further continuation of this trend and the financial infrastructure platforms themselves work across a whole network of financial networks including banks, financial institutions, and up and coming digital wallets. These developer platforms will abstract away all of the complexity of working across multiple financial partners, and allow applications of all types to embed fintech services within their products (both fintech and non-fintech apps).

fintech infrastructure stack

Fintech Infrastructure 

All of the above fintech trends and more are pushing the requirements of fintech platforms, most notably by the developers who are building fintech apps on top of the legacy and next-generation financial infrastructure.

Below is a market map of this new fintech financial infrastructure space:

Fintech Infrastructure Market Map.png


Traditional Financial Institutions

This category includes all of the traditional banks working with fintech companies on a business level (white-label banking), developer level (banking-as-a-service), and the legacy core banking infrastructure providers (FIS, Fiserv, etc). Many of the early adopter banks have been smaller community oriented banks, with the exception of BBVA who developed their platform through the acquisition of Simple. 

Banking-as-a-service Platforms

This category is primarily other startups who are trying to provide the entire functionality of a bank (Deposit, Savings, Send, Withdraw) to developers to allow them to build financial features within their own applications.

Banking as a service API market map.png

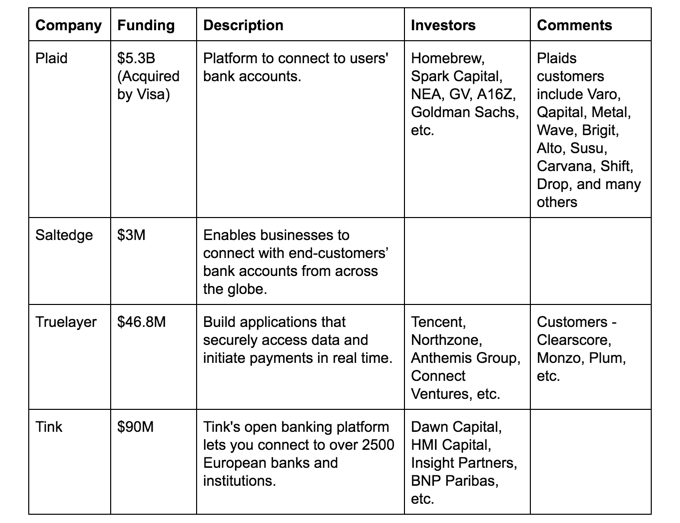
Banking Connector API’s

This category is primarily platforms and services that allow users to connect their own bank accounts (Chase, Bank of America, Wells Fargo, Citi) through API’s that developers can embed into their own application.

Lending as a Service

This category are platforms who are proving end-to-end lending solutions which can be embedded within fintech applications or work within lenders & financial institutions. This includes some of the traditional players in addition to new startups offering these services via API.

Lending as a Service Map.png

Card Issuing API - Targeting developers

This category is primarily platforms that allow developers to issue cards (Credit card, virtual cards, and prepaid cards) within their applications to their end users.

Credit Card Issuing API.png

Brokerage Infrastructure API’s

These are API’s that allow developers to offer stock trading & brokerage services within their fintech applications.

Brokerage Infrastructure API’s.png

Other Financial Infrastructure API’s

Here are a few examples of other fintech infrastructure companies allowing developers to build stock trading, marketplace, and other complex forms of payments within their applications.

Other Fintech API's.png

Banks vs. Developers

Many of the tools, API’s, and infrastructure created for financial applications were originally created for internal banking customers; however, now with the rise of consumer and business fintech applications, we are going to see outside developers as the new emerging customer.

Plaid, a fintech infrastructure company recently acquired by Visa for $5.3B, stated in their M&A report that they have 2,600+ fintech developers on the platform. As we see more and more products embedding financial features into their own applications, we’re going to see a huge expansion of “fintech developers” across all market segments and verticals.

Thanks

A big thank you to Charley Ma, Mengxi Lu, Edith Yeung, Jason Choi, David Gogel, and Kim McCann for helping to review and provide feedback on this post.

Appendix

“Future evolution of fintech infrastructure”

Fintech applications are most commonly thought of as being built on top of existing banking systems.

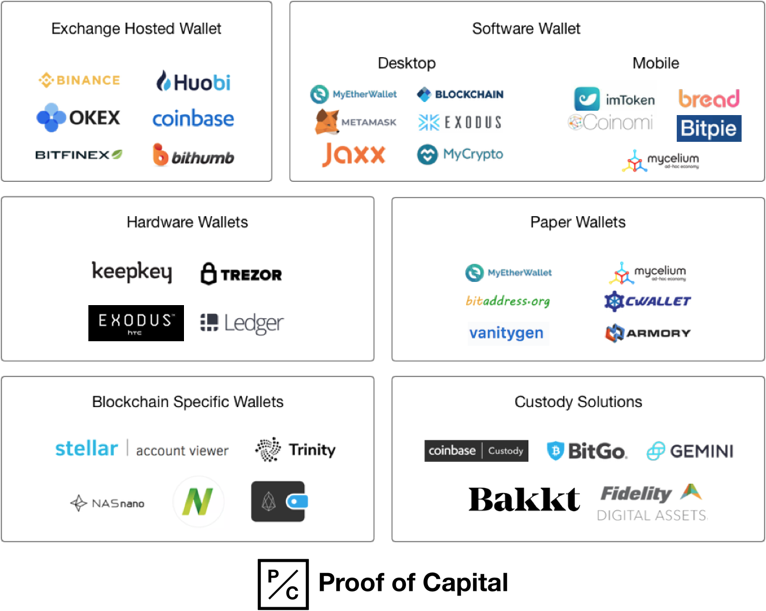
However, as this infrastructure layer is solved there are new banking rails which are still in their infancy - most notably digital assets. This includes Bitcoin, Ethereum, and most interesting of all, the variations of Stablecoins (USDT, USDC, etc.).

Given digital-assets are programmable in nature, many of the first order problems are already solved from day one. Digital assets are stored in a common data layer (the blockchain), with a shared interface (UXTO’s or ERC20’s), and build on inter-operable protocols (assets can be stored among any digital wallets). 

There is a huge open question whether digital-asset first platforms (Coinbase/Binance) will be able to bridge these divides first, or whether traditional fintech apps will move down the digital stack first. 

This cross-section is one of the most interesting areas we are paying attention to closely. 

Digital Asset Fintech Infrastructure.png

Cryptocurrency Data 101: Market Landscape of the Bitcoin & Crypto Data and Analytics Sector

It has been said that the next wave of $1B+ companies in the cryptocurrency sector will be data and analytics firms.

Within this market, I wanted to have a better understanding of all of the data providers within the Bitcoin and crypto sector. Most importantly to better understand all of the various sources people consume data regarding the crypto market.

Unlike the traditional financial markets, most of the underlying data is public within the Bitcoin and cryptocurrency ecosystem. This leads to a unique development where there is a large and growing consumer & institutional demand for data within the cryptocurrency market.

Below is a quick primer on crypto data and an overall landscape into the data & analytics space today. 

Primer on Crypto Data

One of the most interesting things about the crypto space, is the overwhelming majority of data is public. For example, on the Bitcoin network, every single transaction from the beginning of time (genesis block) until now, is recorded on the Bitcoin blockchain.

This includes every transfer between people, between exchanges, to service providers, and to merchants. Any amount of value that has moved from one address to another is recorded for all time on the Bitcoin blockchain. The same is true for most other blockchain networks out there as well: Ethereum, Litecoin, XRP, etc.

Because all data is recorded on the blockchain, this creates an interesting dynamic where all of the most valuable economic data for the $250B cryptocurrency industry, is hiding in plain sight. Unlike the traditional finance system, if you have a question about Bitcoin, you can most likely find the data to answer your question.

Companies within the data and analytics market aim to pull together all of this public data to help participants (consumers, funds, exchanges, miners, etc) make sense of the crypto market. 

Data Sources

Mohamed Fouda lays out that the majority of data about crypto comes from three primary sources:

  1. Exchange Data (Spot markets, derivative markets, OTC)

  2. Blockchain Network Data (block explorers, hashrate, supply schedules, etc.)

  3. Off-Chain Data (github, nodes, clients, community channels)

All of this data is largely public, especially anything recorded on the various Blockchains. The few sources that are not inherently public are:

  • Over the Counter (OTC) trading information

  • Exchanges (spot and derivatives) - Prices, order books, volume information, etc. are largely public however anything to do with user, demographic, or geographic data is more difficult to derive.

  • Off-Chain data is not necessarily public; however, most of the underlying sources are for the most part easy to pull (github, reddit, twitter, telegram, etc.).


Who consumes blockchain data?

Everyone in the crypto ecosystem consumes some form of blockchain data, including but not limited to:

  • Consumers - To check prices of Bitcoin and various cryptocurrencies.

  • Traders - Pulling data to build trading models.

  • Consumers - To confirm transfers via block explorers.

  • Exchanges - Reconciling & tracking the flow of funds.

  • Hedge funds - Pulling data for arbitrage, etc.

  • Institutional investors - Reconciling pricing data for bookkeeping.

  • Miners - Monitoring hashrate & profitability.

  • Regulators - Monitoring suspicious activity.

  • Journalists - Researching the source of truth. 

  • DApp developers - Monitoring app usage and statistics .

Because blockchain data is inherently public, all kinds of participants can now see and utilize the underlying financial & network data within the crypto ecosystem. 

Market Ecosystem Map

Below is an ecosystem map of the data and analytic providers within the whole crypto ecosystem. I also attempted to categorize all of the companies based on the core activities they provide (some of these companies provide many services all in one). 

Please tweet at me @mccannatron if:

  • I missed any major sources of information (particularly regional providers)

  • If you feel I have have mis-categorized any company in particular.

  • If there are any other companies we should consider adding.

The visual market map has a truncated list of companies, with the full listings of all the companies within each category below:

Crypto Data and Analytics Ecosystem Map - Market Cap Providers, Portfolio, DApp, Defi, Insitutional data.png
Crypto Data and Analytics Ecosystem Map - Mining, block explorers, blockchain analytics, media.png

Price & Market Cap Information Providers

Price and market cap providers, provide - you guessed it - price and market cap data of Bitcoin and other cryptocurrencies. 

These services are typically free and public and also expose other surrounding data including volume, supply, charts, exchange data, etc. Since most of these services are public, in my opinion, it’s fair to stack rank them based on the monthly web traffic each service provides. 

Using this metric, the top 5 price & market cap information providers are: CoinMarketCap, TradingView (price & charting), CoinGecko, CryptoCompare, and WorldCoinIndex. See below for the full ranking: 

Bitcoin and Crypto Data Analytics Firms - Coin Market Cap Information Providers Companies.png

Data and Analytic Tools

This is the broad category of providers that seek to pull together basic price/market/network data into more meaningful insights. I further break this broad category into a few specific sub-sectors which I grouped together below. 

Again the majority of these services (except for the institutional centric data services) are primarily public so I am using website traffic to stack rank each company in order.

General Data and Analytic Tools

Here are a few of the companies in this category: 

  • Cryptowat.ch - All in one tool including: market data, exchange API's, monitoring,  portfolio tools, etc. 

  • BitInfoCharts - One of the original analytic services providing many charts and graphs of Bitcoin and all the major cryptocurrencies.

  • Coin360 - Infographics and charts looking at different tokens and exchanges.

  • Cryptoslate - A crunchbase like services highlighting various people, companies, products, and more. 

  • Blockchair - Accumulation of network & market data with charts & API's.

Bitcoin and Crypto Data and Analytics Companies.png

Portfolio Tools

Portfolio tools are products and services that focus on helping people track their overall portfolio of Bitcoin and other crypto assets over time, and through various trades. A few of these services have expanded to also cover tax information as well.

  • CoinTracking - Portfolio tracking and reporting

  • Coinigy - Portfolio management and exchange account management 

  • Blockfolio - Portfolio tracker + communications platform

Crypto Portfolio Trackers - Data and Analytics startups.png

DApp/Defi centric tools

Analytic tools that specialize in areas within the application ecosystem including decentralized applications (dApps), decentralized finance (Defi), and Ethereum services.

Ethereum, defi and dapp analytics companies.png

Institutional Centric Data Tools

These include data and analytic firms that specialize in catering to institutional clients (traditional funds, crypto funds, family offices, etc.).

Most of these services are paid subscription only services, so it’s unfair to stackrank by website data; however, it does give us a relative sense of the most popular services. Also some companies do provide reports via their blog and limited publicly available data.

  • TradeBlock - Data platform for institutional investors 

  • CoinMetrics - Provider of market & network data 

  • Delphi Digital - Boutique institutional-grade analysis on the digital asset market.

  • Digital Assets Data - Full scale data acquisition and application platform for institutions. 

Institutional data providers for bitcoin and cryptocurrencies.png

Mining tools

Mining is one of the most important, although often overlooked aspects of the Bitcoin and crypto ecosystem. Mining information providers include looking at real time hashrate’s of various blockchains, profitability calculators, pool profitability, etc. 

The majority of this data is public. Below is the full stack ranking of each provider. The top three are:

Block explorers

Block explorers are the source of truth for network data. 

From a consumer standpoint, people typically use block explorers to confirm & track transactions. On Ethereum you can also use them to verify tokens/supply information and track dApp transactions as well. From a business standpoint, you can also query data directly from the underlying blockchains (via full node) or use block explorers to aggregate directly from the blockchain. 

Below are the largest block explorers (in terms of viewership) with the top 3 being:

  • Blockchain Explorer - Bitcoin & Ethereum explorer offered by blockchain.com

  • Etherscan - Ethereum centric block explorer

  • BTC.com - Bitcoin block explorer with various mining pools overlaid on top of block data 

Blockchain Analytics Firms

These are firms that specialize in collecting and analyzing transaction data across Bitcoin and other crypto networks. The most typical use-cases are for Governments, exchanges, and financial firms, to track suspicious activity. 

All of these firms analysis’ are private so public website data can only give us a sense on the most used services. 

  • Chainalysis - Prevent, detect, and investigate crypto compliance violations. 

  • Eliptic - Blockchain analytics for regulatory compliance 

  • Crystal - Analytics for due diligence and compliance

  • Anchain - Analytics for threat detection & threat intelligence. 

Blockchain analytics compliance aml investigation tools startups.png

Media

I included media here as well because the media plays an important role in synthesizing market & network data to all of the participants in the crypto ecosystem. Further, outside of price, this is one of the main forms people take to consume information within the crypto ecosystem. 

Below are the media sites stackranked by website views, with the top five media publications being:

  • CoinDesk - Blockchain news and events. 

  • Cointelegraph - Crypto news and analysis 

  • CCN - Market update and crypto news. 

  • NewsBTC - Bitcoin news and analysis

  • The Block - Crypto news which shares a lot of great original analysis 

Geographic Analysis

While trying to understand all of the places people consume blockchain data & analysis, one of the interesting byproducts is also a high level overview of the geographic dispersion of the crypto industry.

Unlike previous innovation cycles, the crypto industry was global from day one. While looking at the top 3 geographic sources for all of these services above, here is one look at where the crypto industry is located: 

Crypto industry location by geographic location.png

Even though the United States is one major center of the crypto industry, it is by no means the only major geographic the industry is located in.


My Key Takeaways

After looking into the total landscape of all the various data providers in the Bitcoin and cryptocurrency sector, here are my biggest takeaways: 

  • Because the core blockchain data is inherently public, the whole ecosystem has a much greater level of access to data (vs. traditional finance).

  • There is a large and growing consumer demand for data and information within the crypto ecosystem.

  • We will likely see large companies built on both the consumer end of the spectrum and institutional end of the spectrum.

  • Yahoo Finance alone has 170M monthly views on their homepage, so we still have some time before the “crypto to finance flippening”. 

If you are an entrepreneur working in this space building unique data services with the crypto industry, I’d love to chat with you. My contact info is listed on our fund website: Proof of Capital.

Crypto Mining 101 - Overview & Landscape of the Mining Industry

As of July 2019, Bitcoin miners generate $6B+ in revenues (mining rewards + transaction fees) on an annualized basis. 

Mining and the underlying hardware that secures Bitcoin and other cryptocurrency projects is an often overlooked market within the cryptocurrency sector. However in conjunction with the exchange landscape, mining is one of the core markets which generates significant revenues.

In this post I will share an overview of the Bitcoin & crypto mining space, the underlying hardware which powers mining, an ecosystem landscape, and dive into the revenue & market size of the space.

How Cryptocurrency Mining Works 

Proof-of-work (mining) is the process in which new transactions are added to the Bitcoin blockchain and how the correct order of such transactions are agreed upon (consensus). 

One of my favorite analogies of the process is to think of it like a sudoku puzzle. It’s a puzzle that takes a lot of brainpower to solve, but once it’s solved it's very easy for everyone else to verify that you have found the correct answer.

This video below gives one of the best visual representations to more intuitively understand how blocks are created, chained together, how transactions are added into the blockchain, and how mining plays a central role in this process: 

Essentially, miners (computers geographically distributed around the world) compete to solve a computationally intensive puzzle which verifies the next block in the blockchain (in addition to the underlying transactions within the block). The miner who solves this puzzle first is the person who is able to claim the reward (the “coinbase reward” + transaction fees). Once the next block is found all of the miners on the network are able to verify that the block is correct, and move onto solving the next block in the chain.

The Role Miners Play in the Bitcoin & Crypto Ecosystem

All of the computers around the world racing to solve the next puzzle are the participants that make up the mining ecosystem. The collective computational resources are one of the core ingredients which provides the underlying security guarantees Bitcoin provides.

Through this network, Bitcoin participants are able to expect:

  • Their transactions will be confirmed on the Bitcoin blockchain.

  • Their transactions will be in the correct order (protect against double spends).

  • The history of the Bitcoin blockchain will stay intact (immutability).

In return miners are compensated both in newly minted Bitcoin (“coinbase rewards”) + the transaction fees associated with each transaction. If participants want stronger guarantees on when their transaction will be added to the Bitcoin blockchain, they can increase the transaction fees they are willing to pay for their transactions.

Hardware Used in Mining

While in the beginning of the Bitcoin network, it was profitable to mine Bitcoin using consumer grade central processing units (CPU’s), the Bitcoin network has developed to such a scale where it is impractical to do so now.

The Bitcoin ecosystem is largely dominated by application specific integrated circuits (ASIC’s). For most  other cryptocurrencies, graphics processing units (GPU’s) and field-programmable gate array (FPGA's) are the dominant form factors. A number of coins also exist with the same hashing algorithm at Bitcoin (SHA256) that are compatible with Bitcoin mining ASICs.

Hardware used in crypto mining ASIC GPU FPGA CPU.png

Mining Ecosystem Landscape

Below is a graphic of the mining sector in its totality, from the chips to the end user services:

Cryptocurrency mining ecosystem: Foundry, miners, pools, hashrate.png

Foundry

Taiwan Semiconductor (TSMC) and Samsung are the two core semiconductor foundries which produce all of the silicon wafers which go into mining hardware. Taiwan 🇹🇼in particular has a dominant share of the chipset supply chain. 

For example: NVIDIA, AMD, Xilinx, Bitmain, and Cannan all use TSMC for their core production lines.

cryptocurrency mining foundry: TSMC and Samsung.png

Packaging, Testing, Assembly

Once the wafers are complete you need to test them, cut them apart, package them into the final chip, and retest. This whole process is typically handled by OSAT companies (outsourced assembly and test companies) with the two largest of such being ASE Group (Taiwan) and Amkor Technology.

Cryptocurrency mining: OSAT Testing ASE Amkor SPIL.png

IC Design and Manufacturers 

The companies which design and sell the chips are typically referred to as fabless chip companies (the fabrication itself is left to the foundry and OSAT companies). 

For GPU’s, the two top manufacturers are NVIDIA and AMD. For FPGA’s, the top manufacturer is Xilinx. For crypto specific ASIC’s, the top three companies are Bitmain, Canaan, and Pangolin Miner (producer of the Whatsminer line).

In addition to these three manufacturers there are other IC design companies in the space including: Ebang, Innosilicon, Bitfury, Obelisk, and others. 

Cryptocurrency Mining IC manufactuers nvidia amd bitmain canaan.png

Miners & Mining Farms

After the chips have been produced, they can now be used to mine cryptocurrencies. ASIC’s are especially designed to mine one mining algorithm (typically SHA256 & Bitcoin) while GPU’s have more flexibility built in.

Miners include: people using one machine to mine, small mining operations (5-10 machines), medium sized mining farms (10-100 machines), large scale mining operations (100-1,000 machines) to industrial scale mining farms (1,000+ machines). Some of the largest operations I’ve heard of so far are in the range of 100,000’s of machines across multiple geographies. 

In addition to designing the chips some of the manufacturers mine themselves as well (Bitmain, Canaan, Pangolin). Bitmain, for example, publicly discloses their “self-mining” monthly.

Any sized mining operation can be pointed at a mining pool (more on these later) or if large enough they can self mine - aggregating all of their hashpower to find blocks directly, without commingling their hashrate with other miners. 

*It is quite controversial that the mining chip producers potentially use their own machines to mine before selling them. However if you really do have a device that generates revenue, there is no reason why you would leave it unused in inventory, but rather you would utilize it until you could sell it.


Pools (Single and multi-currency)

For individual to non-industrial miners it is more economically rational to join a pool rather than to self mine. Pools aggregate the hashpower of many miners together to smooth out the reward curves for each individual miner. The pool is in charge of optimizing all of the hashpower, running the mining notes, collecting & distributed rewards, and taking a fee on top for the service.

There are some pools that specialize in specific cryptocurrencies (Sparkpool: Ethereum & Grin) and other pools which have setup various pools covering all of the top cryptocurrencies (Antpool, F2Pool, Poolin, Slushpool, etc). All of these pools started by specializing in one cryptocurrency (typically Bitcoin) and have thus expanded to cover all forms of cryptocurrencies.

One of my favorite analogies of how mining pools work is to think of it like the office lottery pool. By pooling together all of the lottery tickets, all of the individuals (miners) have a better chance of winning the reward (block reward).

However with mining pools you are both trusting the service to both report the correct earnings and the correct number of tickets everyone in the pool has. To bring transparency there are services like PoolWatch that try to track and compare the reporting across various mining pools.

Cryptocurrency mining pools antpool F2pool Poolin Sparkpool.png

Hashrate Marketplaces

As a miner in addition to using your own hashrate for mining, you also have the option to sell your hashrate to someone else. Often, this is done in a marketplace - the biggest of such marketplaces is NiceHash. A smaller, peer-to-peer marketplace is Mining Rig Rentals

On these marketplaces, people can both sell their hashrate and/or purchase hashrate on any given set of mining algorithms across any kind of cryptocurrencies. Although there are a lot of reasons why someone would want to buy hashrate, one of the top reasons is buying hashrate is used as a form of onramp into cryptocurrencies. 

Often times people are using hashrate to speculate on various cryptocurrencies — e.g. want to purchase SHA256 hash rate and use it for Bitcoin SV instead of Bitcoin. (a terrible trade…)


Cloud mining

Cloud mining are services where consumers can purchase hashrate contracts directly, instead of operating any hardware themselves. It’s similar to the hashrate marketplaces above the cloud mining services typically are operated by one central supply. 

Two of the biggest companies in this space are Genesis Mining (US) and Bitdeer (Asia). Again similarly to above one of the top reasons is buying hashrate is used as a form of onramp into cryptocurrencies. Through this method, people can use fiat to purchase Bitcoin and other cryptocurrencies directly without going through an exchange. 

Smart Miners

Smart miners is a new category that has emerged. Mining is a complex endeavor in which participants need to have an understanding of hardware, networking, energy, forecasts of hashrate, optimizing for specific algorithms, etc. On top of this, all of these inputs are constantly changing on a daily basis with new long tail cryptocurrencies constantly coming and going.

Smart Miners, like Honeyminer, aim to optimize all of these factors to allow miners, both consumers and professionals, to earn as much as possible with the hashpower they have. Two other similar products are HashFish and Cudo Miner

In a short period of time these products have aggregated a considerable amount of the supply side hashpower of the marketplace.

Size and Revenue of the Mining Market

The crypto mining industry generates over $8 billion in revenue on an annualized basis.

Revenue comes from both the block rewards + the transaction fees included in every single block on all proof-of-work blockchains. Based on the most recent CoinMetrics data on June 25th, 2019 the mining rewards, here is the weekly, monthly, and yearly revenue run rates of mining in total.

Revenue of bitcoin mining ethereum litecoin zcasn.png
Market share of bitcoin mining.png

In the world of cryptocurrency mining, Bitcoin still dominates with 75% of all of the mining revenue being generated by the Bitcoin network alone. 

This also matches Bitcoin’s dominance by market cap where today (July 1st, 2019) Bitcoin comprises 60% of the total market cap of all cryptocurrencies according to CoinMarketCap.

However the overall revenue the mining sector generates is directly tied to the price of the underlying cryptocurrency, so it is highly reflexive back to the underlying cryptocurrency market (hence why Wall Street will have a tough time understanding the companies in this sector). More on this below. 

Understanding the Profitability of the Mining Sector

The overall revenue, cost, and profitability of participants in the mining sector is hinged on a few key factors. 

Capital Expenditure (Capex)

The main capex expense for miners is the cost of the mining machines themselves + any facilities/buildout which are needed to run the operation.

For example if you wanted to purchase 10,000 of the most recent Bitmain S17 models, this would cost $16M at retail price. Large miners can get special pricing; however, when machines are highly in demand it’s hard to even secure supply much less negotiate on rates. 

This does not take into account the cost of setting up the facilities which have turned from hobbyist activities into real professional industrial scale operations.

industrial scale bitcoin mining facility.png

Operational Expenditure (Opex)

The main opex expense for miners is the cost of electricity to power the machines on a daily basis. 

For example. if you were running 10,000 Bitmain S17 miners 24/7 this would cost you $36,000 per day (~$13M per year) in energy cost at $0.05 per kilowatt hour (kWh) - just to power the miners alone. 

The average cost of electricity is highly variable based on where you live and what electricity source you are using:

average cost of electricity in various countries china india germany.png

Miners are inherently incentivized to find the cheapest sources of energy around the world, which is why Coinshares estimates that 75% of the energy that powers the Bitcoin network comes from renewable sources, largely hydroelectric energy. 

In addition to the energy costs to power the mining machines, the other ongoing opex costs include: cooling, staff, maintenance, security, and general facility operations. A general rule of thumb is to 1.5x the energy cost to give a rough estimate on the ongoing opex costs.

Following our example above for a mining operating of 10,000 Bitmain S17 a rough estimate on the cost side would be:

  • $16M Capex + $3M (import tax) + $4M (Facilities + security)

  • $20M Opex (yearly)

  • $67M Revenue potential (based on today’s Bitcoin price). 

This is a rough estimate just to show the scale of factors miners are dealing with. The true cost would be highly dependent on your geographic location, buildout, etc.

However even these factors are always in flux, due the the market factors which will we will cover below.

Market factors

While opex and capex are two factors miners can control, there are market forces at play which greatly determine the profitability of mining. 

Miner costs & available supply

Unlike many traditional products, the mining producers (Bitmain, Canaan, Whatsminer, etc) will vary the price on the mining machines based on the profitability (the Bitcoin price) of the machines.

During big pull runs the price swings of the underlying cryptocurrencies + the mining machines themselves can swing wildly. In crazy periods there are whole secondary markets dedicated to just purchasing more hardware, and older machines can even become profitable again too.

In general I would always expect the price of machines to be priced close to the fair value the machine can generate at that point in time.

On top of this mining hardware tends to be supply constrained, especially with the newer machines. In keeping with our Bitmain S17 example, these machines are entirely sold out. Talking to some of the people on the team they don’t expect to have supply available until November at the earliest.

Hashrate

The chance of a miner solving the next block is directly proportional to their hashrate relative to the hashrate of the total Bitcoin network (using Bitcoin as an example for simplicity).

An oversimplifying example to illustrate this is if you as a miner controlling 1% of the Bitcoin hashrate (compared to the overall Bitcoin hashrate) then you would expect to earn 1% of the total rewards from the Bitcoin network. 

Bitcoin hashrate over time volatility.png

However, the overall hashrate of the Bitcoin is always changing so the profitability of each miner depends on how many miners enter or leave the ecosystem. The Bitcoin protocol does have an internal method on adjusting the difficulty level (to learn more about this, go here).

Bitcoin Price

Since the block reward is paid out in the underlying cryptocurrency. For example if you are mining Bitcoin, the block reward you earn is paid out in Bitcoin itself. Given this the reward amount is directly tied to the price of Bitcoin itself.

The more Bitcoin is worth, the more mining rewards are worth. To engage in mining you have to be inherently long the cryptocurrency you are mining, because your profitability is dependent on it.

One of the major reasons why Bitcoin is the dominant cryptocurrency (outside of being first) is Bitcoin’s transparent, open, and fair supply schedule. From the genesis block, Bitcoin has a fixed supply schedule with a fixed supply - there will only be 21M Bitcoin ever created. 

Mining is the way new Bitcoin are created and emitted into the world. Today each Bitcoin block reward is 12.5 Bitcoin; however, this amount decreases every 210,000 blocks. At block #630,000 (estimated around May 24th, 2020) this reward will drop to 6.25 Bitcoin - this is referred to as the halvening event.

To see how halvening events have affected the Bitcoin and other cryptocurrency networks before, check out this great post by CoinMetrics looking at prior halvening events.

If you would like to go even further into the supply schedule of Bitcoin and what happens after all of the Bitcoin is created, see these two posts about Bitcoins supply and overall security budget (shoutout to Dan Held for covering this topic throughly).

TLDR - The price of Bitcoin and underlying supply schedule of Bitcoin greatly affects the profitability of mining itself. 

My Key Takeaways

After diving deep into the cryptocurrency mining space here are my biggest takeaways: 

  • While often overlooked the mining industry & underlying hardware plays a very important role in blockchain networks. 

  • Hashrate = cryptocurrency = money. For many people hashrate is the key on-ramp into the crypto world.

  • Just like we see the financialization of Bitcoin, I predict we will see a similar financialization of hashrate.

If you are an entrepreneur working in this space building marketplaces, exchanges, financial products, or any related services within the mining industry I’d love to chat with you. My contact info is listed on our fund website: Proof of Capital.


A big thank you to Edith Yeung. Noah Jessop, Jane Wu, and a few other large miners who prefer to stay anonymous for providing feedback on this writeup.

Remittance Market— Primer and Landscape

This post was originally written on May 25th, 2019 on Medium.

Note — I originally wrote this writeup on the Remittance industry in April 2019. I’m releasing a redacted version of this writeup publicly. All of the numbers and stats in this article were from April.

An Introduction to Remittances

Remittance is the capital flow between individuals in two different countries, typically by foreign workers to individuals in their home country. According to the World Bank, the total remittance market is comprised of $550B in total flows, 80% of which are within emerging economies.

Because of globalization, remittances have increased sharply worldwide and have increased 5x from 2000 to 2018. Remittance is a significant activity and can be as high as ⅓ of the total GDP of various countries and is 3x the value of developmental aid.

The global average for sending $200 worth of value between countries is 6.94%. This means that ~$48B is taken directly out from remittance transfers through fees, middlemen, and financial institutions. These exact rates are highly regionalized, and will be discussed further below.

The goal of this document is to give a short introduction to the remittance market, a landscape of existing participants within this market, and how the blockchain could impact this market sector.

Primer on the Remittance Market

Remittances sit within the larger market of cross border payments, which includes all forms of payments between consumers and businesses

payments landscape crypto.png

Zooming in on the remittance category, the majority of remittances payments are handled by traditional banks & credit unions and specialized money transfer operators (MTO) which specialize in cross border payments. Some of the largest providers in this space include Western Union, UAE Exchange, MoneyGram, and up-and-coming operators such as TransferWise.

Because of the macroeconomic forces of globalization & migration,remittances have been growing 10% on average worldwide. Three key reasons why the remittance market is growing faster than worldwide GDP are:

  1. The number of migrants grew faster than world population, in total there are 266M international migrants (240M migrants workers and 26M total refugees). This means they are proportionally more people likely to send remittances.

  2. Migrants were able to earn higher incomes, because of relocation towards higher earning countries.

  3. It has become cheaper to send remittances, falling from 10% on average to 7% on average. This reduction in cost is likely to have allowed migrants to send a larger fraction of their incomes.

Source: World Bank — Migration and Remittances: Recent Developments and Outlook

Source: World Bank — Migration and Remittances: Recent Developments and Outlook

For remittances, sending money abroad has traditionally been an expensive task (vs. domestic transfers), with a never-ending supply-chain of middle men, paperwork, and hidden fees. On top of this, it is estimated that 80% of these remittance payments are still handled via physical cash.

Below is a diagram showing just how complex the movement of money internationally can become:

Source: Bank for International Settlements — Cross-border retail payments report

Source: Bank for International Settlements — Cross-border retail payments report

In terms of the overall market, remittances are highly fragmented based on geography and by specific corridors, which is the combination of 2 countries: where the money is sent and received.

Below are the largest receivers of remittances and the top coordinators worldwide.

Source: World Bank — Migration and Remittances: Recent Developments and Outlook Presentation

Source: World Bank — Migration and Remittances: Recent Developments and Outlook Presentation

Source: World Bank — Migration Remittances Factbook

Source: World Bank — Migration Remittances Factbook

The business model of cross border transactions is primarily a mix of two variables: direct fees and foreign-exchange (FX) fees.

  • Direct Fees — Direct fees include all of the fees related to the transfer itself. Examples include: a flat fee, transfer fee, % of transaction fee, outgoing fee, amendment fee, bank-to-bank fee, etc.

  • Foreign-Exchange Fees (FX) — The FX fee is the difference between the mid-market rate, and the actual rate money is exchanged into. Many remittance companies charge a premium on top of their internal FX rate and keep the difference.

These two factors combine together to create the ultimate margin the money transmitter takes. Today the worldwide average is about 7%. Western Union, for example, had a split of 70% and 27% between fee and FX revenue respectively in its 2016 results.

Below are some example mixes of fees + FX charges from some of the highest cost corridors in the world.

Source: World Bank — Migration and Remittances: Recent Developments and Outlook Presentation

Source: World Bank — Migration and Remittances: Recent Developments and Outlook Presentation

Remittance Market Landscape

remittance market landscape.png

Money Transfer Operators (MTO’s)

MTO’s dominate the remittance market and make up the majority of remittance volume worldwide.

Financial Institutions
For traditional financial institutions & banks, international remittances make up a relatively small portion of their overall product offerings; however, on average, banks charge a much higher rate (11% vs. 7%) for international money transfers.

Financial Institutions remittance landscape.png

Fintech Startups
Fintech startups have targeted the remittance market due to their large incumbent market share, although with the exception of TransferWise, very few have broken out. In addition, these startups mostly target digitally savvy customers with bank accounts vs. cash agents — which is the lion share of the market.

Blockchain Specific Fintechs
Blockchain technology has the potential to dramatically lower sending rates and add much needed transparency into the market. Although for the time being it does not seem like any of the new startups have dented the overall market yet.

Incumbent Advantages

Brand, Agents, Cash, Compliance, and Acquisition.

While on the surface, incumbents like Western Union looks like a great target for disruption, there are deep structural reasons why they are still maintaining their lead.

  • Brand — Incumbent providers have huge brand & awareness advantages across the globe with 90%-100% brand awareness in all of the top remittance corridors across the world.

  • Network — Incumbent providers have a huge embedded network of local MTO operators in countries globally, Western Union has 204 regulatory licenses, 500K retail locations, 100K ATM’s, 150M customers, covering every major currency & corridor around the world today. Many of these retail locations are also binded to exclusive contracts to Western Union as well.

  • Cash — It’s estimated that of the total remittance volume worldwide, 80%+ of this is handled via cash payments which also require MTO’s to have both physical presences & cash inventories. For the most part, fintech startups are not serving this segment of the market.

  • Compliance — What most startups don’t realize is the cost of transfering money is not the most expensive part, but rather compliance costs. It is inherently difficult to ensure money is being sent compliantly in multiple jurisdictions 24/7, which is why 20%-40% of the remittance cost is due to compliance alone.

  • Acquisition — On top of compliance, since the remittance market is an established market, incumbent players are willing to spend $15–70 per customer depending on the specific corridor they are targeting.

Demand Side: Satisfaction?
For all of these costs, fees, and friction in sending money cross-border — users of incumbent services are generally satisfied with their experience.

On top of this, as mentioned a few times, the majority (80%+) of remittance payments are processed via cash — either on the receiving, sending, or both ends. Even when people have bank accounts remittance senders prefer cash for a few reasons:

  • Many migrant workers are undocumented.

  • Many migrants are afraid of being deported

  • Avoiding taxes by sending cash to family members

  • Not wanting to fill out paperwork to setup bank accounts

Core Value Proposition
In my opinion, most startups are touting cheaper fees, when that is not the main motivating factor for most remittance senders or receivers. Instead new startups should focus on:

  • More transparency (TransferWise)

  • Ability to track payments

  • Lower compliance costs

  • Unique acquisition channels

  • Focus on underserved corridors

The biggest strategic questions any new startup needs to decide on is if they want to focus on more affluent customers first (where all the startups are today) or focus on the larger (but harder) cash market.

Why now?
In the ideal world, sending money cross border should be as easy as sending a message via WhatsApp to anyone across the world. In theory you can send a digital currency, like Bitcoin, quickly and at low cost; however, anything that interfaces with the banking system (especially cash) adds many complications and cost.

There is a massive opportunity to roll up all of these regional players into one large international payments company. Expanding from there to business payments, etc. also massively expands the total adjustable market these new companies can service.

Appendix

Future Evolution of Remittance
Remittances today is most commonly thought of in the most basic function — sending money overseas.

As this fundamental layer is solved digitally, new services can be offered to this customer base, blurring the lines between remittance, checking, and business accounts, etc.

future evolution of remittance.png

Average Transactions Amounts by Providers
Among remittances specialists, average transfer size is much smaller depending on core customer segments. For CurrencyFair and TransferWise that mostly target expats from developed countries, the average transfer size could be few thousands of dollars. For money transfer companies targeting migrants from developing countries, the average transfer size is usually a few hundreds.

  • CurrencyFair — $5,500

  • TransferWise — $2,300

  • Remitly — $500

  • Transfergo — $400

  • WesternUnion — $300

  • WorldRemit — $200

  • Large banks

  • JP Morgan — $15,000

  • BofA — $10,000

  • Citi — $7,000

  • Wells Fargo — $2,000

Additional reading

Digital Asset Custody — Primer and Landscape

This post was originally written on May 18th, 2019 on Medium.

Note — I originally wrote this writeup on the Digital Asset Custody industry in February 2019. I’m releasing a redacted version of this writeup publicly. All of the numbers and stats in this article were from February.

Cryptoassets (excluding private companies) are a $130B industry. While substantial, the market is in its infancy compared to broader financial markets. In order for cryptoassets to continue growing they must be able to support the needs of institutional investors and financial institutions. There are many blockers preventing this growth, with digital asset custodianship being one of the biggest ones.

Compared to the traditional financial infrastructure of transfer agents, central security depositories, custodian banks, and stock exchanges — the digital asset custody landscape is very different in terms of participants, structure, and underlying assumptions.

This document provides a short introduction on how custodianship within digital crypto assets is unique, and give a landscape of the existing participants in the market.

Quick Primer on Storing and Securing Crypto Assets

Cryptoassets are held and secured via a public-private keypair.

  • The public key is your public address in the blockchain system (similar to an IP address).The private key is the secret key which gives you access to your assets on the blockchain.

  • A blockchain wallet is simply a storage system for your private key. A wallet doesn’t “store” any data about your assets — all of that is retained on the blockchain itself.

If needed, here is a quick primer on how a blockchain works.

Why Custody of Crypto-Assets is Different

Cryptoassets are bearer assets in the sense that the control of the private key equates to control of the asset. If the private key is lost (or stolen) this equals to the entire loss of the cryptoasset itself. In other words cryptoassets have a very high asymmetric risk profile.

The best analogy for traditional finance is to think of the private key as a physical stock certificate. Just as the destruction of the physical stock certificate, in the past, would erase all knowledge of ownership, this is the equivalent to the loss of private keys today.

Contrast this within traditional finance where this form of risk is completely offloaded to large custodians, the insurance markets, and ultimately the government who backs many of the asset classes. This type of assurance does not exist within the crypto market today.

We believe there are many important business to be built in providing best-in-class security and custody for cryptoassets. In all other fields we have realized the importance of security and a stable base upon which more innovation can occur. That is even more true in the cryptoasset market.

Custody Landscape
There are broadly three types of places where people store their cryptoassets today:

Exchange wallets
Exchanges are the most common place where retail investors store their crypto-assets. It is mentally easier to leave your assets on the exchange removing the need to worry about private-key management. However, since 2011, there have been ~40 exchanges hacked with more than $7B stolen from exchanges (some of these stolen by the exchange operators themselves).

On top of obvious losses there are three other core concerns for institutional investors for using exchanges as their custody providers:

  1. Counterparty risk — Exchanges have previously done forced liquidations and socialized losses on contracts.

  2. Commingling of assets — Exchanges (even reputable ones) do not segregate user accounts and all assets are commingled with one another. This is especially troubling for cryptoassets where all historical movements are tied to the asset and recorded on the blockchain.

  3. Rehypothecation — If exchanges are lending out assets or running reserve based system, this would imply there are more claims on ownership than cryptoassets outstanding.

For all of these reasons it is highly reccomended that if you hold any significant sum of capital via cryptoassets you should either self custody the assets or use a 3rd party custodian which comply to higher institutional standards.

Hardware Wallets

custody crypto landscape.png

Exchange wallets
Exchanges are the most common place where retail investors store their crypto-assets. It is mentally easier to leave your assets on the exchange removing the need to worry about private-key management. However, since 2011, there have been ~40 exchanges hacked with more than $7B stolen from exchanges (some of these stolen by the exchange operators themselves).

On top of obvious losses there are three other core concerns for institutional investors for using exchanges as their custody providers:

  1. Counterparty risk — Exchanges have previously done forced liquidations and socialized losses on contracts.

  2. Commingling of assets — Exchanges (even reputable ones) do not segregate user accounts and all assets are commingled with one another. This is especially troubling for cryptoassets where all historical movements are tied to the asset and recorded on the blockchain.

  3. Rehypothecation — If exchanges are lending out assets or running reserve based system, this would imply there are more claims on ownership than cryptoassets outstanding.

For all of these reasons it is highly reccomended that if you hold any significant sum of capital via cryptoassets you should either self custody the assets or use a 3rd party custodian which comply to higher institutional standards.

Hardware Wallets

hardware wallet ledger.png

Hardware wallets are small USB-like hardware devices that store your private-keys in an air-gapped manner from your computer. In this way even if your computer is hacked, the private keys are still safe within the hardware device itself. Hardware wallets are good for retail-users; however, they are not very ideal for institutional owners of crypto assets where you have more than one user who needs access to assets.

Custody Providers
Custody solutions have been created to fill the gap between retail and institutional buyers of cryptoassets. A few firms building solutions in this space include Fidelity Digital Assets, Coinbase Custody, Anchorage, Bakkt, and others.

Custody providers are ideal for:

  • Institutional investors

  • Investors who require more than one individual to have access to assets

  • Generally customers who need more fine grained access control, permission settings, operational controls, multiple levels of authentication, multi-user access, reporting, etc.

Here is the whole macro level view on the wallet space to see how custody providers fit into the landscape:

Digital Asset Custody Landscape

digital asset custody landscape.png

Here is a deeper dive into the institutional custodian market for crypto-assets:

institutional custody market crypto.png
institutional crypto custody market crypto 2.png

Institutional vs. Retail Market

Currently the entire crypto-asset is mostly represented by retail users — institutional investors make up a very small portion of the market (Estimate ~3% of the market). One of the core reasons why this is the case is because there has not been a trusted custodian developed yet, both Fidelity’s and Bakkt’s solutions are still under development.

Outside of custodianship there are many infrastructure items required for institutional adoption, including: tax and accounting solutions, portfolio management, portfolio reconciliation, portfolio tracking, prime brokers, etc.

Until more of this infrastructure is developed we will not see meaningful adoption by institutions for crypto-assets.

Why now?

Custodianship has long been identified as a need for crypto-assets. Crypto-assets are a $130B industry and we are starting to see the leading edge of institutional interest with Fidelity, the NYSE, Goldman Sachs, and JP Morgan leading the pack.

On top of this, there is already a small base of crypto-asset hedge funds ready to jump start as beta customers, fund development, validate the market, and prove out a custodian solution. As institutional platforms and demand comes on-onboard, this market will expand greatly.

Owning trust for institutions using crypto-assets is a center of gravity that may have power over many valuable areas of crypto. In a sector where trust is scarce, custodians could become the interface for all institutions to the rest of the blockchain world.

Appendix

Future Evolution of “custodianship”
Custodianship for crypto-assets today is most commonly talked about in terms of the the basic core aspects — securely storing and providing access to assets.

As this fundamental layer is solved there are new concepts, well understood in the traditional financial world, which will bridge over into the blockchain world. Today, functions such as proxy voting, dividends, token splits, and tax reporting are not yet standardized functions for crypto-assets.

Given crypto-assets are programmable in nature, in the future, custodianship will not be merely a cost center, but rather the means by which customers interact with the markets.

future of crypto custody 2.png

Typical Process of Buying and Selling Crypto Assets
Unlike traditional financial assets, crypto-assets have a different set of processes buyers must typically follow when purchasing, holding, and selling crypto-assets.

Here is an example diagram of one such process and how the custodian fits into this process. Keep in mind this process would be different if you are interacting with an over-the-counter (OTC) desk or acquiring directly from a counterparty.

Note — Keep in mind this was written before XRP was listed on Coinbase, so the process is simpler now :)

xrp order flow crypto.png

As you can see, each transaction is a multi-step process where each step must be completed with zero errors. If a public address is entered incorrectly, this would result in loss of funds (because crypto-assets are bearer instruments).

The key for crypto-asset custodians is the tradeoff between usability and safety.

  • Usability: Ease and readiness of use

  • Safety: Absence of catastrophic consequences and losses.

If you never needed to use your crypto-assets (hold forever), securing them is not particularly difficult. However, the risk of custodianship increases significantly the more you want to actively use them. Risk is proportional to a number of factors including:

  • Amount of money: The amount an attacker is willing to spend on getting access to your keys, is proportional to the amount they’d make by compromising your keys.

  • Amount and frequency of transactions: The more you need to actively use your crypto-assets whether sending, staking, or selling them — the more opportunity there is for them to get compromised.

  • Amount of employees: The more people you have at your company interacting with and using the cryptocurrencies, the more attack surface area there is as well as room for mistakes or theft by employees.

  • Amount of novel activity: The more outlier events like forks, security flaws, and airdrops occur, the more your custodianship solution must keep pace and evolve.