Cryptocurrency Data 101: Market Landscape of the Bitcoin & Crypto Data and Analytics Sector
It has been said that the next wave of $1B+ companies in the cryptocurrency sector will be data and analytics firms.
Within this market, I wanted to have a better understanding of all of the data providers within the Bitcoin and crypto sector. Most importantly to better understand all of the various sources people consume data regarding the crypto market.
Unlike the traditional financial markets, most of the underlying data is public within the Bitcoin and cryptocurrency ecosystem. This leads to a unique development where there is a large and growing consumer & institutional demand for data within the cryptocurrency market.
Below is a quick primer on crypto data and an overall landscape into the data & analytics space today.
Primer on Crypto Data
One of the most interesting things about the crypto space, is the overwhelming majority of data is public. For example, on the Bitcoin network, every single transaction from the beginning of time (genesis block) until now, is recorded on the Bitcoin blockchain.
This includes every transfer between people, between exchanges, to service providers, and to merchants. Any amount of value that has moved from one address to another is recorded for all time on the Bitcoin blockchain. The same is true for most other blockchain networks out there as well: Ethereum, Litecoin, XRP, etc.
Because all data is recorded on the blockchain, this creates an interesting dynamic where all of the most valuable economic data for the $250B cryptocurrency industry, is hiding in plain sight. Unlike the traditional finance system, if you have a question about Bitcoin, you can most likely find the data to answer your question.
Companies within the data and analytics market aim to pull together all of this public data to help participants (consumers, funds, exchanges, miners, etc) make sense of the crypto market.
Data Sources
Mohamed Fouda lays out that the majority of data about crypto comes from three primary sources:
Exchange Data (Spot markets, derivative markets, OTC)
Blockchain Network Data (block explorers, hashrate, supply schedules, etc.)
Off-Chain Data (github, nodes, clients, community channels)
All of this data is largely public, especially anything recorded on the various Blockchains. The few sources that are not inherently public are:
Over the Counter (OTC) trading information
Exchanges (spot and derivatives) - Prices, order books, volume information, etc. are largely public however anything to do with user, demographic, or geographic data is more difficult to derive.
Off-Chain data is not necessarily public; however, most of the underlying sources are for the most part easy to pull (github, reddit, twitter, telegram, etc.).
Who consumes blockchain data?
Everyone in the crypto ecosystem consumes some form of blockchain data, including but not limited to:
Consumers - To check prices of Bitcoin and various cryptocurrencies.
Traders - Pulling data to build trading models.
Consumers - To confirm transfers via block explorers.
Exchanges - Reconciling & tracking the flow of funds.
Hedge funds - Pulling data for arbitrage, etc.
Institutional investors - Reconciling pricing data for bookkeeping.
Miners - Monitoring hashrate & profitability.
Regulators - Monitoring suspicious activity.
Journalists - Researching the source of truth.
DApp developers - Monitoring app usage and statistics .
Because blockchain data is inherently public, all kinds of participants can now see and utilize the underlying financial & network data within the crypto ecosystem.
Market Ecosystem Map
Below is an ecosystem map of the data and analytic providers within the whole crypto ecosystem. I also attempted to categorize all of the companies based on the core activities they provide (some of these companies provide many services all in one).
Please tweet at me @mccannatron if:
I missed any major sources of information (particularly regional providers)
If you feel I have have mis-categorized any company in particular.
If there are any other companies we should consider adding.
The visual market map has a truncated list of companies, with the full listings of all the companies within each category below:

Price & Market Cap Information Providers
Price and market cap providers, provide - you guessed it - price and market cap data of Bitcoin and other cryptocurrencies.
These services are typically free and public and also expose other surrounding data including volume, supply, charts, exchange data, etc. Since most of these services are public, in my opinion, it’s fair to stack rank them based on the monthly web traffic each service provides.
Using this metric, the top 5 price & market cap information providers are: CoinMarketCap, TradingView (price & charting), CoinGecko, CryptoCompare, and WorldCoinIndex. See below for the full ranking:

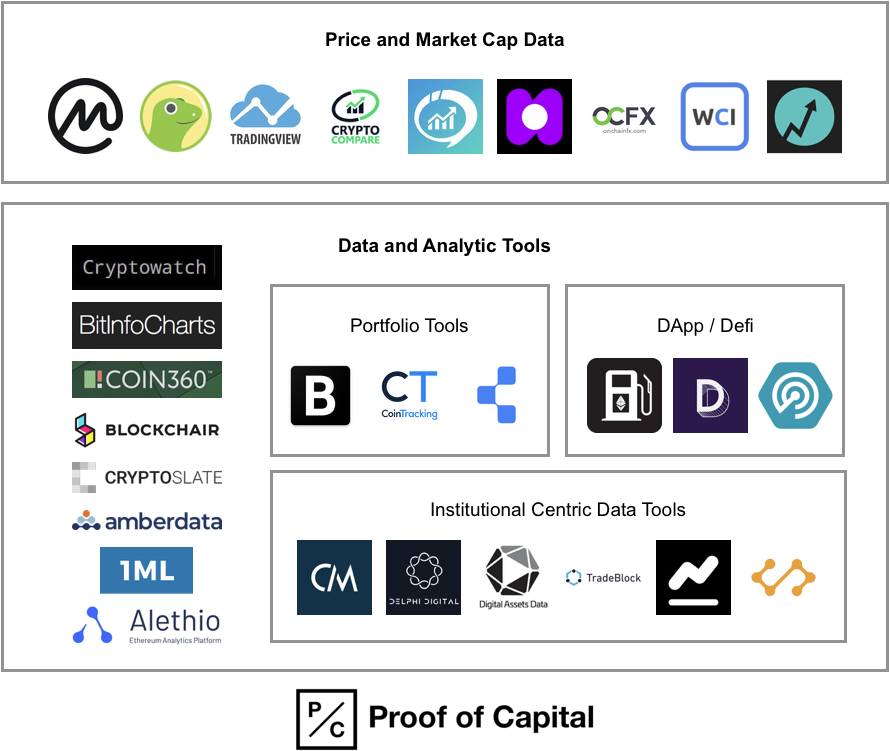
Data and Analytic Tools
This is the broad category of providers that seek to pull together basic price/market/network data into more meaningful insights. I further break this broad category into a few specific sub-sectors which I grouped together below.
Again the majority of these services (except for the institutional centric data services) are primarily public so I am using website traffic to stack rank each company in order.
General Data and Analytic Tools
Here are a few of the companies in this category:
Cryptowat.ch - All in one tool including: market data, exchange API's, monitoring, portfolio tools, etc.
BitInfoCharts - One of the original analytic services providing many charts and graphs of Bitcoin and all the major cryptocurrencies.
Coin360 - Infographics and charts looking at different tokens and exchanges.
Cryptoslate - A crunchbase like services highlighting various people, companies, products, and more.
Blockchair - Accumulation of network & market data with charts & API's.

Portfolio Tools
Portfolio tools are products and services that focus on helping people track their overall portfolio of Bitcoin and other crypto assets over time, and through various trades. A few of these services have expanded to also cover tax information as well.
CoinTracking - Portfolio tracking and reporting
Coinigy - Portfolio management and exchange account management
Blockfolio - Portfolio tracker + communications platform
DApp/Defi centric tools
Analytic tools that specialize in areas within the application ecosystem including decentralized applications (dApps), decentralized finance (Defi), and Ethereum services.
ETH Gas Station - Real time info on Ethereum gas prices
DAppRadar - Ranking site for dapps
LoanScan - Borrowing rates and other stats on Defi lending applications
Defi Pulse - Stats on the Defi ecosystem

Institutional Centric Data Tools
These include data and analytic firms that specialize in catering to institutional clients (traditional funds, crypto funds, family offices, etc.).
Most of these services are paid subscription only services, so it’s unfair to stackrank by website data; however, it does give us a relative sense of the most popular services. Also some companies do provide reports via their blog and limited publicly available data.
TradeBlock - Data platform for institutional investors
CoinMetrics - Provider of market & network data
Delphi Digital - Boutique institutional-grade analysis on the digital asset market.
Digital Assets Data - Full scale data acquisition and application platform for institutions.

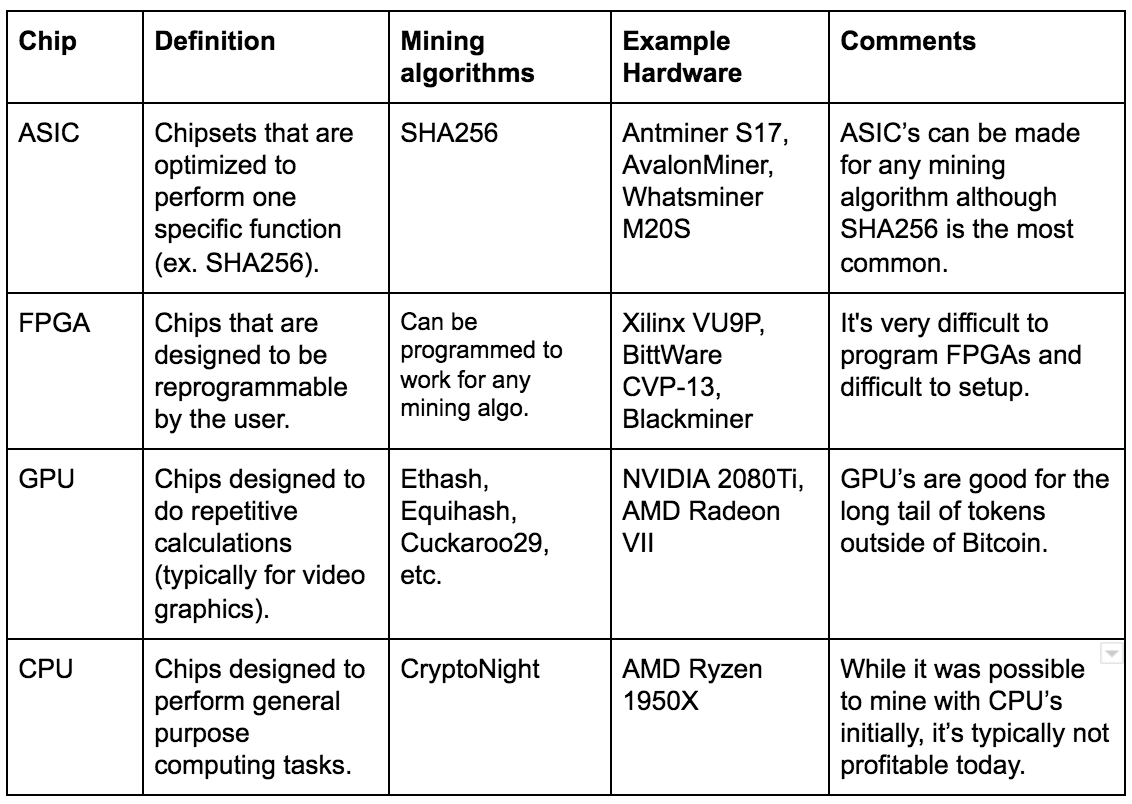
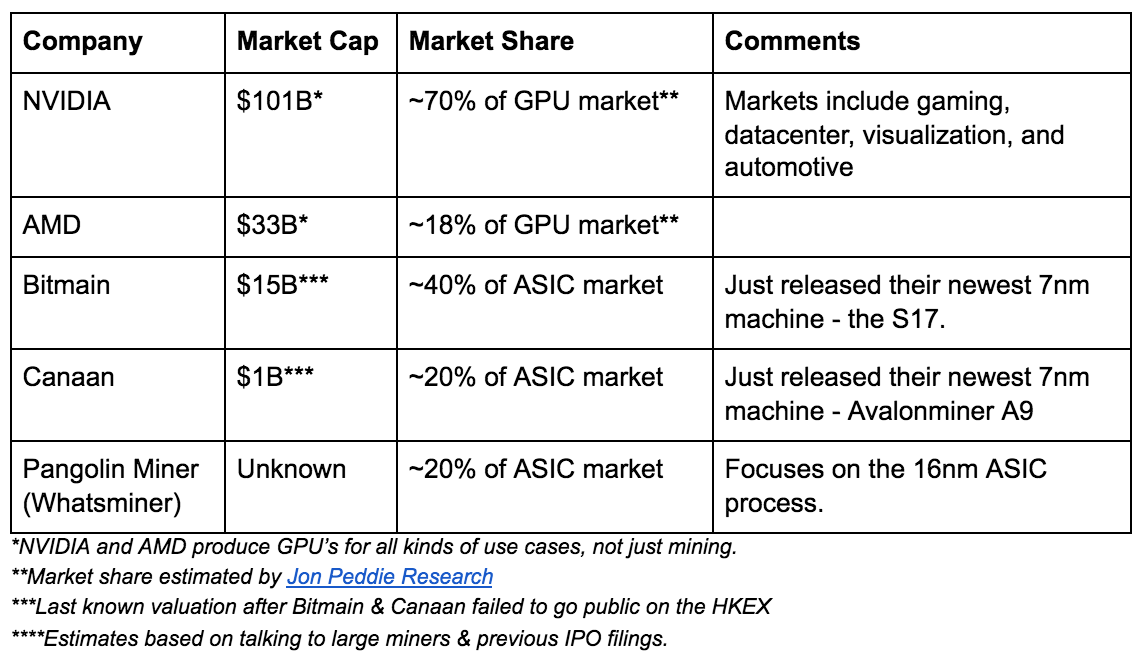
Mining tools
Mining is one of the most important, although often overlooked aspects of the Bitcoin and crypto ecosystem. Mining information providers include looking at real time hashrate’s of various blockchains, profitability calculators, pool profitability, etc.
The majority of this data is public. Below is the full stack ranking of each provider. The top three are:
WhatToMine - Mining profitability calculator
MiningPoolStats - Stats on various pools and networks.
CoinCalculators - Mining profitability calculator & hardware comparison

Block explorers
Block explorers are the source of truth for network data.
From a consumer standpoint, people typically use block explorers to confirm & track transactions. On Ethereum you can also use them to verify tokens/supply information and track dApp transactions as well. From a business standpoint, you can also query data directly from the underlying blockchains (via full node) or use block explorers to aggregate directly from the blockchain.
Below are the largest block explorers (in terms of viewership) with the top 3 being:
Blockchain Explorer - Bitcoin & Ethereum explorer offered by blockchain.com
Etherscan - Ethereum centric block explorer
BTC.com - Bitcoin block explorer with various mining pools overlaid on top of block data

Blockchain Analytics Firms
These are firms that specialize in collecting and analyzing transaction data across Bitcoin and other crypto networks. The most typical use-cases are for Governments, exchanges, and financial firms, to track suspicious activity.
All of these firms analysis’ are private so public website data can only give us a sense on the most used services.
Chainalysis - Prevent, detect, and investigate crypto compliance violations.
Eliptic - Blockchain analytics for regulatory compliance
Crystal - Analytics for due diligence and compliance
Anchain - Analytics for threat detection & threat intelligence.

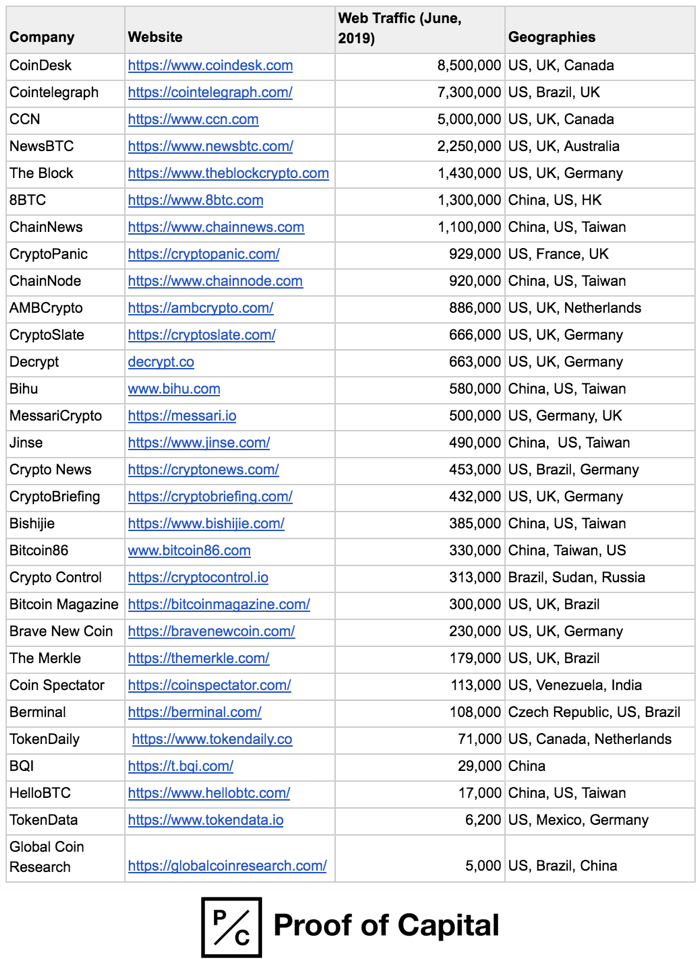
Media
I included media here as well because the media plays an important role in synthesizing market & network data to all of the participants in the crypto ecosystem. Further, outside of price, this is one of the main forms people take to consume information within the crypto ecosystem.
Below are the media sites stackranked by website views, with the top five media publications being:
CoinDesk - Blockchain news and events.
Cointelegraph - Crypto news and analysis
CCN - Market update and crypto news.
NewsBTC - Bitcoin news and analysis
The Block - Crypto news which shares a lot of great original analysis
Geographic Analysis
While trying to understand all of the places people consume blockchain data & analysis, one of the interesting byproducts is also a high level overview of the geographic dispersion of the crypto industry.
Unlike previous innovation cycles, the crypto industry was global from day one. While looking at the top 3 geographic sources for all of these services above, here is one look at where the crypto industry is located:

Even though the United States is one major center of the crypto industry, it is by no means the only major geographic the industry is located in.
My Key Takeaways
After looking into the total landscape of all the various data providers in the Bitcoin and cryptocurrency sector, here are my biggest takeaways:
Because the core blockchain data is inherently public, the whole ecosystem has a much greater level of access to data (vs. traditional finance).
There is a large and growing consumer demand for data and information within the crypto ecosystem.
We will likely see large companies built on both the consumer end of the spectrum and institutional end of the spectrum.
Yahoo Finance alone has 170M monthly views on their homepage, so we still have some time before the “crypto to finance flippening”.
If you are an entrepreneur working in this space building unique data services with the crypto industry, I’d love to chat with you. My contact info is listed on our fund website: Proof of Capital.