Remittance Market— Primer and Landscape
This post was originally written on May 25th, 2019 on Medium.
Note — I originally wrote this writeup on the Remittance industry in April 2019. I’m releasing a redacted version of this writeup publicly. All of the numbers and stats in this article were from April.
An Introduction to Remittances
Remittance is the capital flow between individuals in two different countries, typically by foreign workers to individuals in their home country. According to the World Bank, the total remittance market is comprised of $550B in total flows, 80% of which are within emerging economies.
Because of globalization, remittances have increased sharply worldwide and have increased 5x from 2000 to 2018. Remittance is a significant activity and can be as high as ⅓ of the total GDP of various countries and is 3x the value of developmental aid.
The global average for sending $200 worth of value between countries is 6.94%. This means that ~$48B is taken directly out from remittance transfers through fees, middlemen, and financial institutions. These exact rates are highly regionalized, and will be discussed further below.
The goal of this document is to give a short introduction to the remittance market, a landscape of existing participants within this market, and how the blockchain could impact this market sector.
Primer on the Remittance Market
Remittances sit within the larger market of cross border payments, which includes all forms of payments between consumers and businesses

Zooming in on the remittance category, the majority of remittances payments are handled by traditional banks & credit unions and specialized money transfer operators (MTO) which specialize in cross border payments. Some of the largest providers in this space include Western Union, UAE Exchange, MoneyGram, and up-and-coming operators such as TransferWise.

Because of the macroeconomic forces of globalization & migration,remittances have been growing 10% on average worldwide. Three key reasons why the remittance market is growing faster than worldwide GDP are:
The number of migrants grew faster than world population, in total there are 266M international migrants (240M migrants workers and 26M total refugees). This means they are proportionally more people likely to send remittances.
Migrants were able to earn higher incomes, because of relocation towards higher earning countries.
It has become cheaper to send remittances, falling from 10% on average to 7% on average. This reduction in cost is likely to have allowed migrants to send a larger fraction of their incomes.

Source: World Bank — Migration and Remittances: Recent Developments and Outlook

For remittances, sending money abroad has traditionally been an expensive task (vs. domestic transfers), with a never-ending supply-chain of middle men, paperwork, and hidden fees. On top of this, it is estimated that 80% of these remittance payments are still handled via physical cash.
Below is a diagram showing just how complex the movement of money internationally can become:

Source: Bank for International Settlements — Cross-border retail payments report
In terms of the overall market, remittances are highly fragmented based on geography and by specific corridors, which is the combination of 2 countries: where the money is sent and received.
Below are the largest receivers of remittances and the top coordinators worldwide.
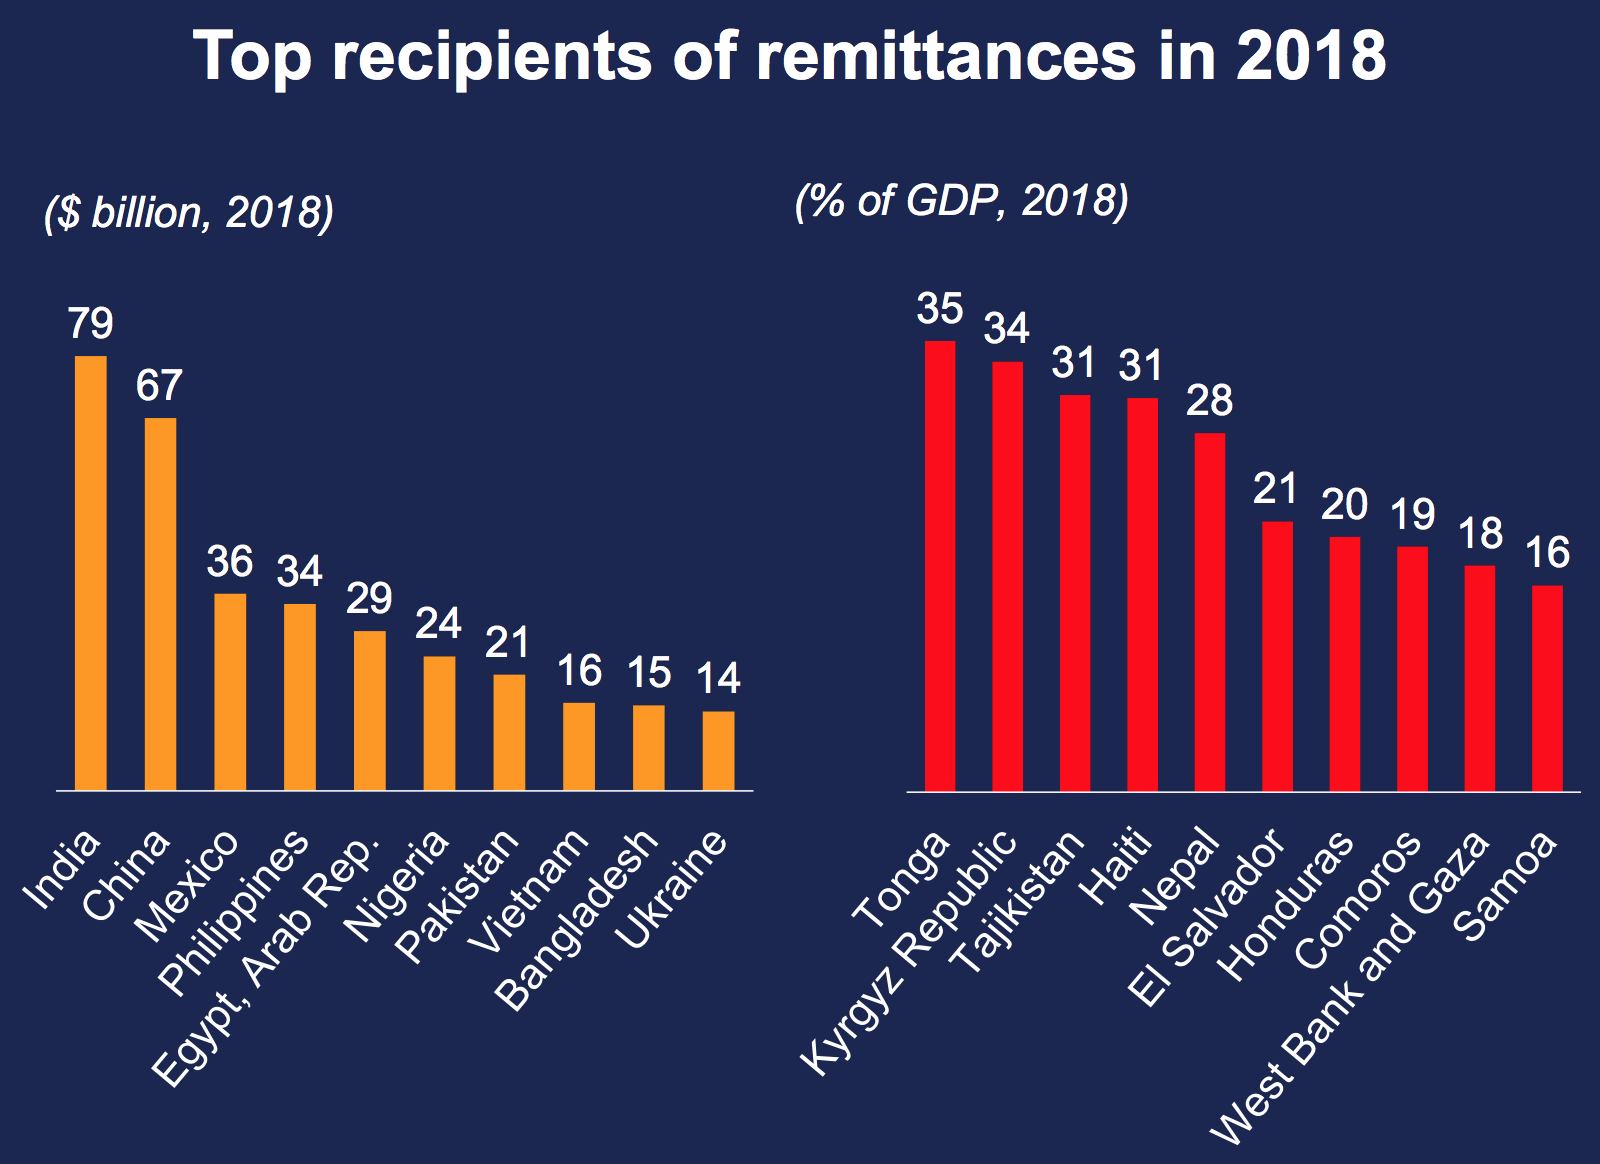
Source: World Bank — Migration and Remittances: Recent Developments and Outlook Presentation

Source: World Bank — Migration Remittances Factbook
The business model of cross border transactions is primarily a mix of two variables: direct fees and foreign-exchange (FX) fees.
Direct Fees — Direct fees include all of the fees related to the transfer itself. Examples include: a flat fee, transfer fee, % of transaction fee, outgoing fee, amendment fee, bank-to-bank fee, etc.
Foreign-Exchange Fees (FX) — The FX fee is the difference between the mid-market rate, and the actual rate money is exchanged into. Many remittance companies charge a premium on top of their internal FX rate and keep the difference.
These two factors combine together to create the ultimate margin the money transmitter takes. Today the worldwide average is about 7%. Western Union, for example, had a split of 70% and 27% between fee and FX revenue respectively in its 2016 results.
Below are some example mixes of fees + FX charges from some of the highest cost corridors in the world.

Source: World Bank — Migration and Remittances: Recent Developments and Outlook Presentation
Remittance Market Landscape
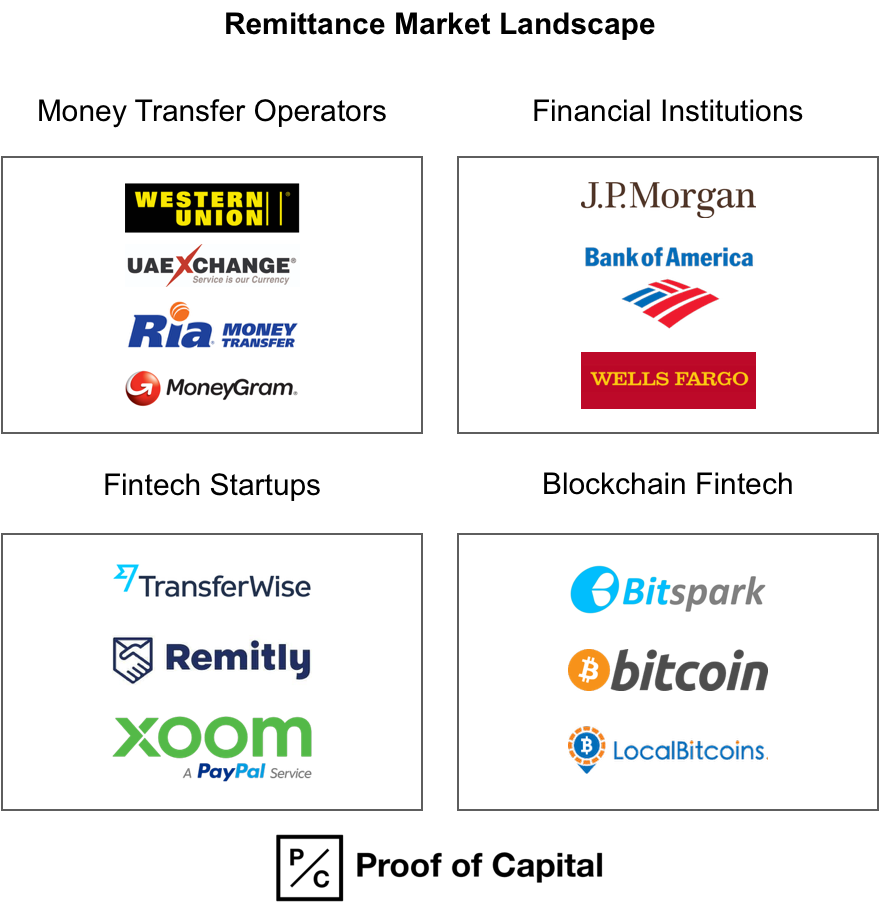
Money Transfer Operators (MTO’s)
MTO’s dominate the remittance market and make up the majority of remittance volume worldwide.

Financial Institutions
For traditional financial institutions & banks, international remittances make up a relatively small portion of their overall product offerings; however, on average, banks charge a much higher rate (11% vs. 7%) for international money transfers.

Fintech Startups
Fintech startups have targeted the remittance market due to their large incumbent market share, although with the exception of TransferWise, very few have broken out. In addition, these startups mostly target digitally savvy customers with bank accounts vs. cash agents — which is the lion share of the market.

Blockchain Specific Fintechs
Blockchain technology has the potential to dramatically lower sending rates and add much needed transparency into the market. Although for the time being it does not seem like any of the new startups have dented the overall market yet.

Incumbent Advantages
Brand, Agents, Cash, Compliance, and Acquisition.
While on the surface, incumbents like Western Union looks like a great target for disruption, there are deep structural reasons why they are still maintaining their lead.
Brand — Incumbent providers have huge brand & awareness advantages across the globe with 90%-100% brand awareness in all of the top remittance corridors across the world.
Network — Incumbent providers have a huge embedded network of local MTO operators in countries globally, Western Union has 204 regulatory licenses, 500K retail locations, 100K ATM’s, 150M customers, covering every major currency & corridor around the world today. Many of these retail locations are also binded to exclusive contracts to Western Union as well.
Cash — It’s estimated that of the total remittance volume worldwide, 80%+ of this is handled via cash payments which also require MTO’s to have both physical presences & cash inventories. For the most part, fintech startups are not serving this segment of the market.
Compliance — What most startups don’t realize is the cost of transfering money is not the most expensive part, but rather compliance costs. It is inherently difficult to ensure money is being sent compliantly in multiple jurisdictions 24/7, which is why 20%-40% of the remittance cost is due to compliance alone.
Acquisition — On top of compliance, since the remittance market is an established market, incumbent players are willing to spend $15–70 per customer depending on the specific corridor they are targeting.
Demand Side: Satisfaction?
For all of these costs, fees, and friction in sending money cross-border — users of incumbent services are generally satisfied with their experience.

On top of this, as mentioned a few times, the majority (80%+) of remittance payments are processed via cash — either on the receiving, sending, or both ends. Even when people have bank accounts remittance senders prefer cash for a few reasons:
Many migrant workers are undocumented.
Many migrants are afraid of being deported
Avoiding taxes by sending cash to family members
Not wanting to fill out paperwork to setup bank accounts
Core Value Proposition
In my opinion, most startups are touting cheaper fees, when that is not the main motivating factor for most remittance senders or receivers. Instead new startups should focus on:
More transparency (TransferWise)
Ability to track payments
Lower compliance costs
Unique acquisition channels
Focus on underserved corridors
The biggest strategic questions any new startup needs to decide on is if they want to focus on more affluent customers first (where all the startups are today) or focus on the larger (but harder) cash market.
Why now?
In the ideal world, sending money cross border should be as easy as sending a message via WhatsApp to anyone across the world. In theory you can send a digital currency, like Bitcoin, quickly and at low cost; however, anything that interfaces with the banking system (especially cash) adds many complications and cost.
There is a massive opportunity to roll up all of these regional players into one large international payments company. Expanding from there to business payments, etc. also massively expands the total adjustable market these new companies can service.
Appendix
Future Evolution of Remittance
Remittances today is most commonly thought of in the most basic function — sending money overseas.
As this fundamental layer is solved digitally, new services can be offered to this customer base, blurring the lines between remittance, checking, and business accounts, etc.

Average Transactions Amounts by Providers
Among remittances specialists, average transfer size is much smaller depending on core customer segments. For CurrencyFair and TransferWise that mostly target expats from developed countries, the average transfer size could be few thousands of dollars. For money transfer companies targeting migrants from developing countries, the average transfer size is usually a few hundreds.
CurrencyFair — $5,500
TransferWise — $2,300
Remitly — $500
Transfergo — $400
WesternUnion — $300
WorldRemit — $200
Large banks
JP Morgan — $15,000
BofA — $10,000
Citi — $7,000
Wells Fargo — $2,000
Additional reading
Cross-border retail payments (By the Bank for International Settlements)
A vision for the future of cross border payments (by McKinsey)
Global payments 2018: A dynamic industry continues to break new ground (By McKinsey)
Migration and Remittances: Recent Developments and Outlook (By the World Bank)
Migration and Remittances: Recent Developments and Outlook Presentation (By the World Bank)
Migration and Remittances: Fact Book (By the World Bank)
Western Union: permanent leader of international money transfer (By SaveOnSend)
Money Transfer Startups: race against time? (By SaveOnSend)
Xoom Money Transfer: The Disruptor That Wasn’t (By SaveOnSend)
MoneyGram: whack-a-mole of money transfers? (By SaveOnSend)
Western Union: Investor Day Presentation 2016 (Cross Border Platform)